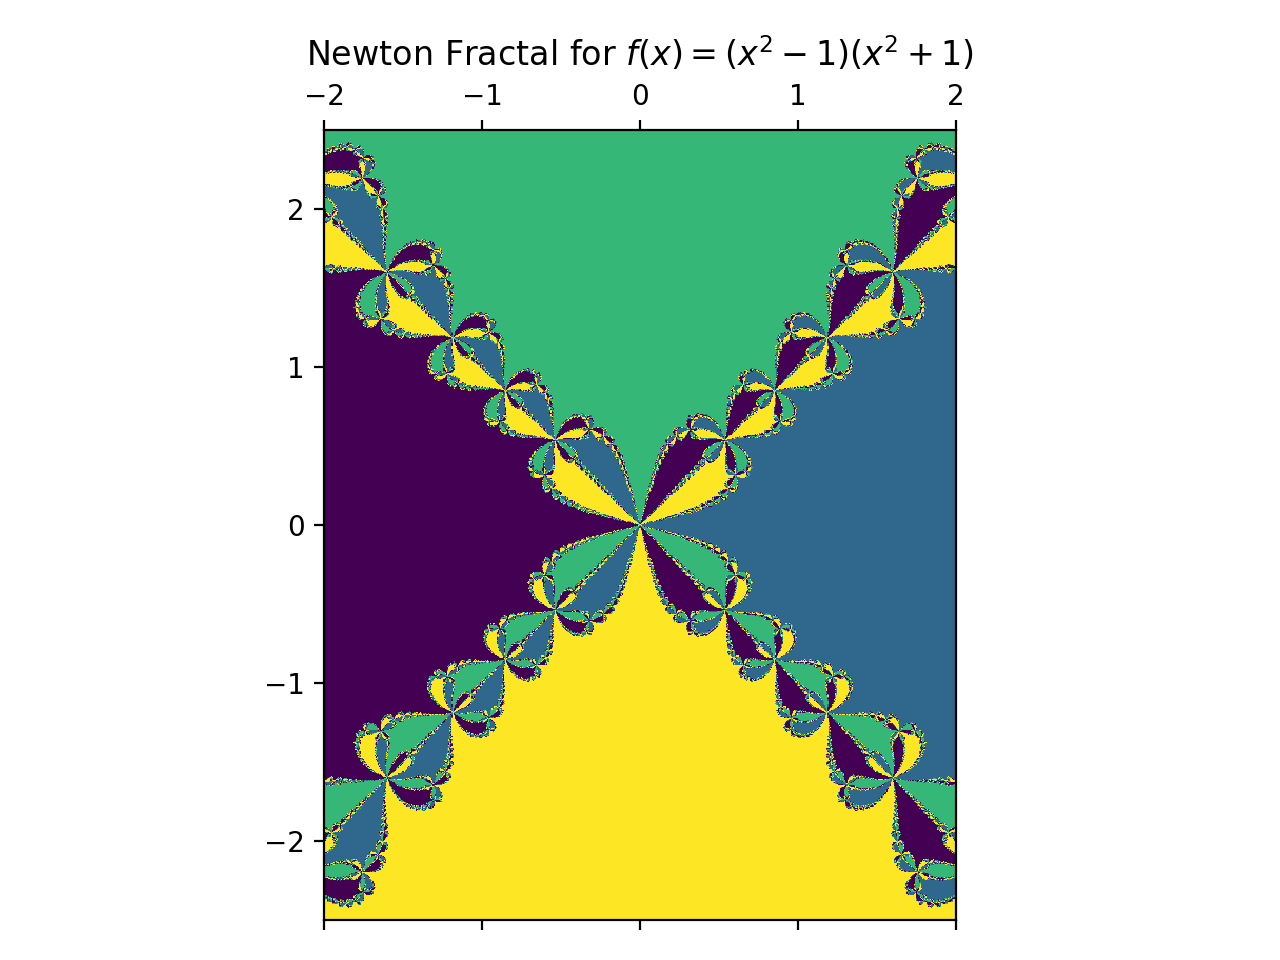
Create a Plot
To create plot from the model, we call the method plot, and
pass in the axes limits, along with the resolution of the plot we
want. This returns a matplolib.figure.Figure. To plot a fractal
for the range -2, 2 and -2.5 , 2.5 for x and y-axis respectively
and of resolution (600,900):
>>> p = model.plot(-2, 2, -2.5, 2.5, (600,900))
>>> p.show()
This creates the following plot: